Online Charts

 Online Charts

Subject: Digital Technologies

Year Level: 6

Strand: Processes and Production Skills

Sub Strand: Acquire, store and validate different types of data and use a range of commonly available software to interpret and visualise data in context to create information (ACTDIP016)

Link to the Resource:

http://www.onlinecharttool.com/

https://www.mindmeister.com/823700803#

Cross Curriculum Priorities and General Capabilities: Critical and Creative Thinking, Personal and Social Capability, Information and Communication Technology (ICT), Numeracy

Links to other areas: Mathematics, Science, HASS

Classroom activity using this resource: Online Charts is a website designed to create charts which can be printed, emailed or saved as an image. As a registered user it can also be saved online for future editing. Students are able to choose from a wide variety of charts, including;

Although primary students are not required to create the more difficult charts, by using this website enables differentiation and exposes the gifted and talented students to extended learning.

There are numerous activities that can be done using this resource, whether it be with a science, mathematics or HASS focus. The following example could be used when teaching the Science Inquiry Skill of Planning and Conducting; observe, measure and record data with accuracy using digital technologies as appropriate (ACSIS104).

                                                                    What Makes Mold Grow More Rapidly?

Students will create bread specimens using bread, mold spores and sealable sandwich bags. These will be placed in three different environments and data of growth of mold will be recorded at the same time each day throughout the experiment. Growth is measured using a transparent plastic grid sheet (10mm x 10mm squares). The recording should be done until there are significant measurable results.

Students will record the data on paper during the experiment and then using Online Charts create the appropriate charts  at the conclusion of the experiment. Photos should also be taken throughout and then added to the final display of data.

Future experiments could also be done by changing some of the variables, for instance, keep the temperature the same but use different types of bread, add moisture to the slices, or put different amounts of sugar or lemon juice onto the slices. Ensuring that only one thing is varied at a time.

Please refer to Martin Shuttleworth’s website for detailed instructions on the experiment items and method  https://explorable.com/mold-bread-experiment. Variations may need to be made to Shuttleworth’s experiment to suit the class, for example recording the growth of mold may need to be done every 3 days to cover the weekend break.

How to use this resource:

This resource is quite explanatory as you progress along, once clicking on “Design Your Chart” you are navigated through the website and prompted where to insert the required information. There are options to personalise your chart by changing colours and fonts etc. Upon completion of the chart you are able to print, save onto computer, email, or save online for future editing. Within the website there is also a Help section for FAQs and a Contact Us option.

Below is a short tutorial created by Michael McIlwraith in which he talks step by step through an example of creating a pie chart. Please note that some of the information he refers to may not be relevant as he is delivering this tutorial to adult learners undertaking a particular unit of study.

Tynker

TynkeTynkerLogo_Fotorr is a browser-based application used to teach your students how to program as they create games and animated projects. Tynker can be used on any computer (desktop, laptop, notebook, Chromebook) with an internet connection. It can be used on an iPad, however some features are not supported. As it is browser-based, it works best in Google Chrome and Safari browsers.
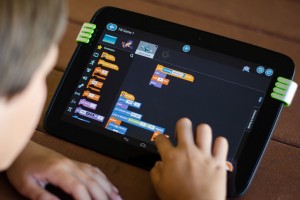
Students can easily learn to code using the visual programming language by solving fun puzzles and creating original projects and games. Students gain an excellent foundation in programming and computational thinking, preparing them to transition to any mainstream object-orientated programming language.

Tynker has multiple learning modules; allowing students to work at their own pace, with each lesson is designed to run between fifty and sixty minutes. As it is browser based, students are able to work from home if the activity is not completed within the specified lesson. Tynker has been created to keep students engaged from start to finish and Tynker also caters for a variety of learning styles.

Teachers are able to assess their students’ learning through creating a multiple-choice questionnaire at the end of a module.

Each student is able to create a unique project, which can then be shared with friends and family.

For more information on Tynker, visit: https://www.tynker.com/?t=reset

    Subject: TechnologiesTynker

    Strand: Digital Technologies – Knowledge and Understanding

    Sub-Strand: Representation of data

    Year level: Year one to year six


Cross-curriculum priorities and General Capabilities:

  • Literacy;
  • Numeracy;
  • Information and Communication Technology;
  • Critical and Creative Thinking; and
  • Personal and Social Capability.

Links to other learning areas:

  • English;
  • Mathematics;
  • Science; and
  • The Arts (Visual Arts). 

How to use Tynker:

Visit the Tynker YouTube channel for a variety of short videos, including how to get you and your class started: https://www.youtube.com/channel/UC2MAKe5X7pohhiMZ4nzdInA

Below are a couple of suggested YouTube clips for you to view:

What is in a Tynker lesson: https://www.youtube.com/watch?v=Bko9qtCeb2A

Preparing for your first Tynker lesson: https://www.youtube.com/watch?v=ZmTbED57tes


References:

ACARA. (2015). Australian Curriculum. Retrieved from http://v7-5.australiancurriculum.edu.au

SCSA. (2014). Digital Technologies. Retrieved from http://k10outline.scsa.wa.edu.au/home/p-10-curriculum/curriculum-     browser/technologies/digital-technologies2

Tynker. (2015). Tynker – Programming courses for kids. Retrieved from https://www.tynker.com

Tynker. (2016). Tynker. Retrieved from https://www.youtube.com/channel/UC2MAKe5X7pohhiMZ4nzdInA


Hour of Code


HOUR-OF-CODE[1]

*Note for this review I have used the West Australian Technologies Curriculum sourced from SCSA.
(http://k10outline.scsa.wa.edu.au/home/p-10-curriculum/curriculum-browser/technologies)

Strand:
Digital Technologies

Sub strands:
Representation of Data
Digital Implementation

(Specific sub strands codes can be found under these headings dependant on what Year level is being focused on.)

Year Level:

Hour of Code can be adapted and related to all years from Kindy to Year 12. Difficulty levels can also be adjusted/selected.

Link to the resource:

code.org website: https://code.org

hour of code link: https://code.org/learn

Cross curriculum priorities and general capabilities:

Numeracy
Critical and creative thinking (CCT)
Information and Communication Technology (ICT)

What is code.org and Hour of Code?

Code.org was an organisation founded in 2103. Their main aim and goal is to develop diversity and give everyone an opportunity to develop their knowledge in relation to computer science (code.org, 2016).

Hour of Code is a global movement that has been implemented by code.org. Since it has commenced it has reached millions of students around the world who have participated in hour long tutorials that build from basic coding to more difficult coding as the tutorial progresses. Hour of Code is generally promoted throughout Computer Science Education Week, however it is used throughout the year around the world to help develop students skills (code.org, 2016).

Why implement this resource into my classroom?
The Hour of Code program can be extremely beneficial in the classroom for various reasons:
1. It helps to create awareness of the importance of computer science/computational thinking across all ages, genders and races
2. It teaches students the basics of computer coding and being able to use data to problem solve
3. It highlights that the same data can be represented in different ways
4. It provides an interactive forum for learning to occur
5. Students can work individually or collaboratively

I saw this program used whilst I completed my most recent practicum. It pushed students to think critically and also provided a task that settled and refocused students attention after an interrupted morning. The program was also used by students with disabilities in this particular classroom, highlighting that it is a program that caters to student diversity within the classroom.

How to use this resource/begin:
Hour of code can be implemented within the classroom all year round. It is easy to be adapted and can be used by teachers who might not know a great detail about coding and computer science themselves. To use this resource in the classroom all teachers must do is try the available tutorials online and select the one that they wish to implement with their class. Teachers must then book a time and the rest is generated by the hour of code website. For students to participate the school must have access to either computers or tablets (the hour of code can be used on any browser).


Book Creator for iPad

logo-retina

*Note for this review I have used the West Australian Technologies Curriculum sourced from SCSA.
(http://k10outline.scsa.wa.edu.au/home/p-10-curriculum/curriculum-browser/technologies)

*This program can be used in the classroom if schools have access to iPads

Strand:
Digital Technologies

Sub strands:

Digital Systems
Representations of Data
Creating solutions by- Designing

(specific content descriptor codes will be found under these sub strands dependent on the Year group that is focused on).

Year Level:

Can be used for all Year levels.
However, would recommend implementation from Year 3 upwards to get the most out of the app.

Link to the resource:

https://itunes.apple.com/au/app/book-creator-for-ipad-create/id442378070?mt=8

Cross curriculum priorities and general capabilities:

Literacy
Critical and creative thinking (CCT)
Information and Communication Technology (ICT)

What is Book Creator App for iPad?

This app is the Number one book app in 80 countries that was also rated the best Educational app at the 2015 BETT awards. For the cost of $7.99 this app allows students to create their own e-books by simply using the iPad. Students can create several different types of books ranging from: Picture books, comic books, textbooks, journals and photo books.

Why implement this resource into my classroom?

This app is extremely useful in the classroom as it can be easily linked between the Technology curriculum and other cross curricular areas. For example students may develop a text throughout a series of English/Literacy lessons which they then use to publish in the book creator app. This does not only assess their literacy skills but by using this technology to present their work it develops their digital technology skills such as design,  using digital systems and representing data.

I saw this app used within a Year 4 classroom. Students were using this program to create a visual representation of a narrative they had written in a unit of work. Students were extremely engaged throughout the series of lessons as it provided an interactive manner in which they could create instead of handwriting/drawing yet again. They enjoyed using the different textual design features the app had to offer and the final products the students created were outstanding.

How to use this resource/begin:
To use this resource schools must have access to iPads/mac software. Once the app is downloaded some exploring of the app as a class may be required, e.g. how to insert text, images, using the pen tool etc.  Once students are familiar with how to use the software they can begin creating their ebooks. After the books are completed sharing is simple through either emailing it to the teacher for printing, using a cloud service to upload too etc.